
Ability test · Charts and dashboards
Discover who can read workplace data and judge what it really shows
Six workplace data sets, including charts, tables and dashboards, each with four questions, test calculation and the judgement to spot a misleading chart. The report shows score band, speed and accuracy. Assessor and Candidate versions are available.
See what candidates see
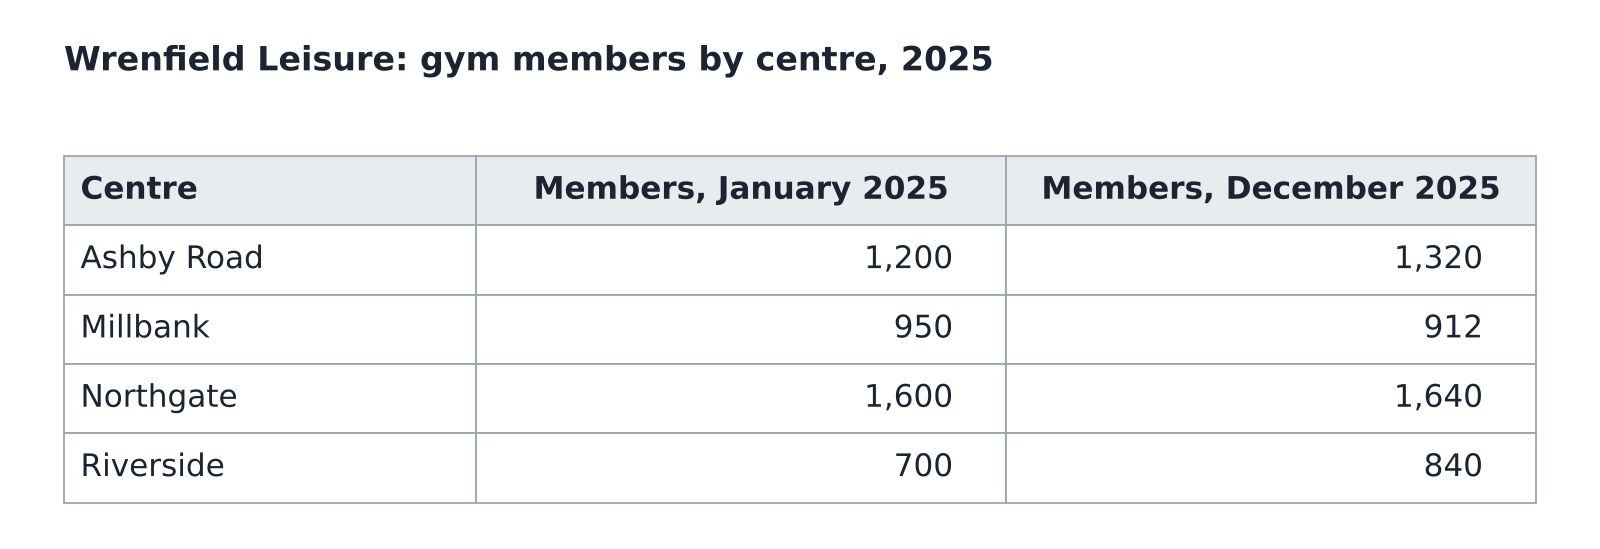
Six workplace charts, tables and dashboards with four questions each: 24 questions in 25 minutes.
Every candidate gets clear instructions and examples before the test starts. To try the full test yourself, ask us for a free trial.
What the Data Interpretation Test measures
The Data Interpretation Test measures how well candidates read and use workplace data: charts, tables and dashboards like the ones they will meet at work. It goes beyond calculation to the judgement that matters in practice, such as spotting a misleading chart and knowing what the data does and does not show.
Reading values accurately
Finding figures in charts, tables and dashboards using their labels, units and axes.
Calculating
Differences, percentage changes, averages, shares and rates, sometimes combining two sources.
Comparing and spotting trends
Telling a real trend from a one-off change, and largest increase from largest percentage increase.
Judging what the data supports
Deciding whether a statement is true, false, or cannot be told from the data, including where a chart could mislead.
Why organisations choose Viewpoint ability tests
Fair and objective
Every candidate takes the same test, scored the same way, so decisions rest on evidence rather than impressions.
Candidates know what to expect
Clear instructions and example questions come before the test starts, so nobody is caught out by the format.
Reports you can act on
Clear results and score bands from Very Low to Very High, ready for shortlisting or a feedback conversation.
Fits your process
Use it to screen applicants early, to shortlist, or to add objective evidence at the final stage.
Reports that do the work for you
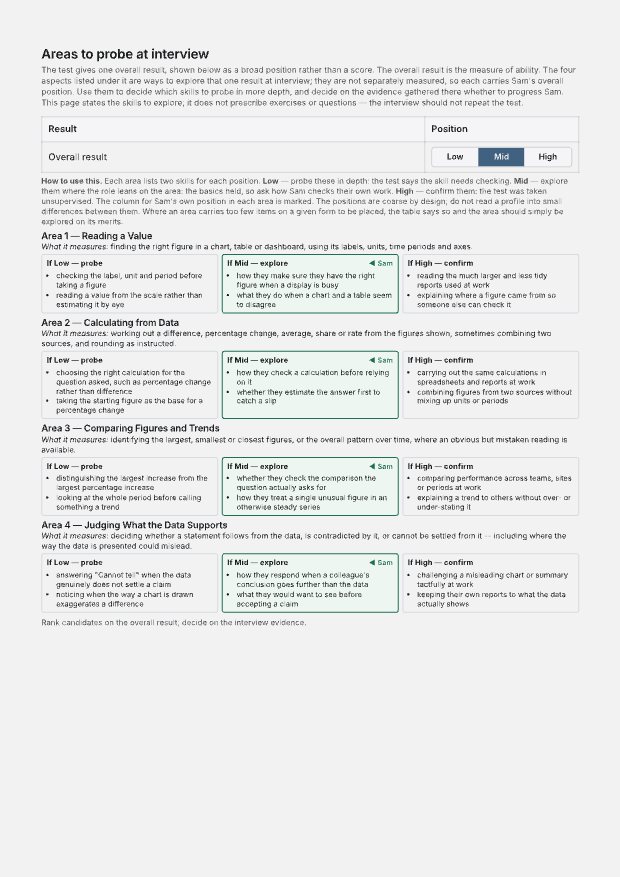
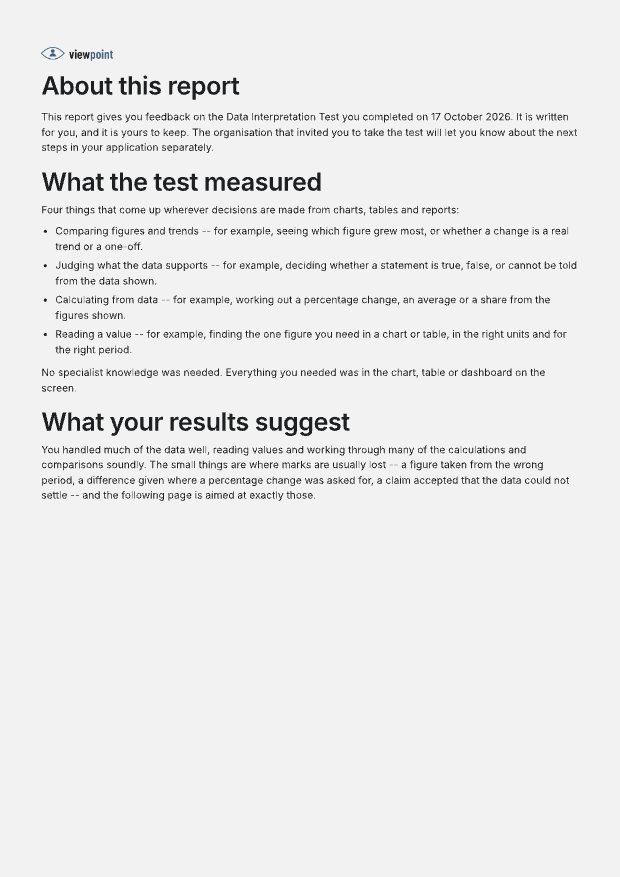
The report shows the candidate's score and score band (Very Low to Very High), with speed and accuracy. It comes in two versions: an Assessor Report with interview questions, and a Candidate Report with no scores and practical development advice.
View sample
Interview Report
For interviewers
- Scores and behavioural interpretation
- Interview questions to explore strengths and development areas
- Helps structure a fair, consistent interview
View sample
Candidate Report
For the person who took it
- Constructive feedback in plain English
- No scores shown
- Practical suggestions for development
Who it’s for
The test is designed for roles that read data to make decisions.
Analyst hiring
Assess reading values, spotting trends and judging what the data supports.
Finance roles
Check that candidates can calculate accurately from tables and dashboards.
Operations and projects
Find people who use data soundly to make day-to-day decisions.
How it works
- 1
Invite
Send candidates their link from the Viewpoint platform. They can take the test wherever suits them.
- 2
Practise, then take the test
Candidates read the instructions and try example questions before the test starts.
- 3
Get the results
Results are ready as soon as the candidate finishes. Download the report and use it straight away.
At a glance
- 24 questions, completed in 25 minutes
- Six data sets (charts, tables, dashboards), each with four questions
- 18 multiple-choice questions (A–E) and 6 True / False / Cannot tell statements
- Eight parallel versions
- Calculator and rough paper allowed; 5 untimed practice questions with feedback
Related tests
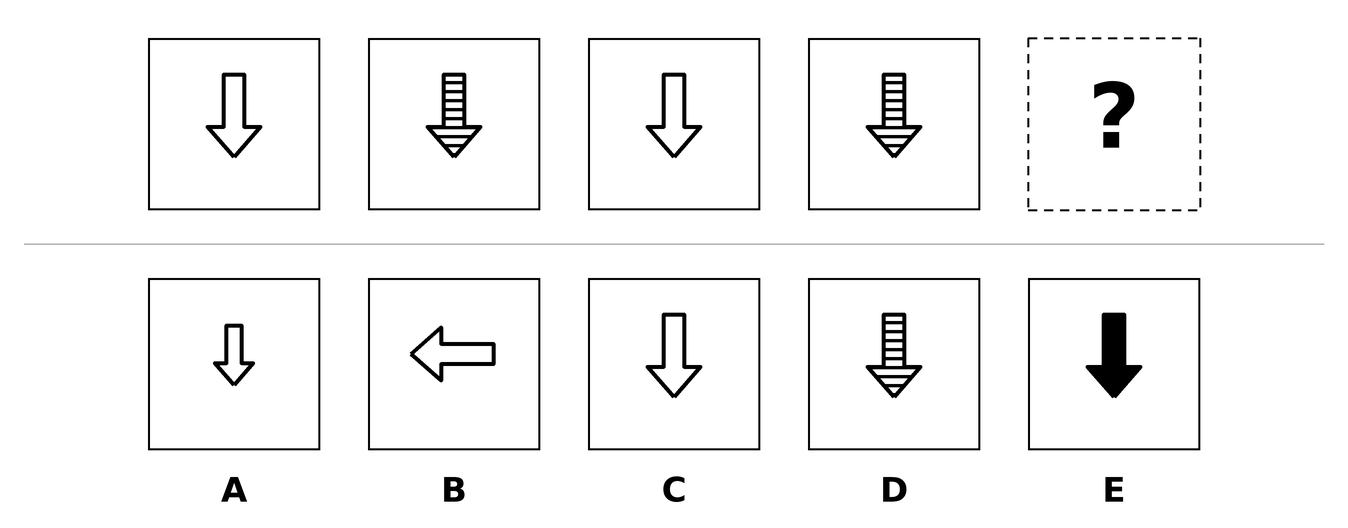 Abstract Reasoning Test20 'what comes next' figure series in 10 minutes. Candidates spot the rules that change each figure and choose the next one.
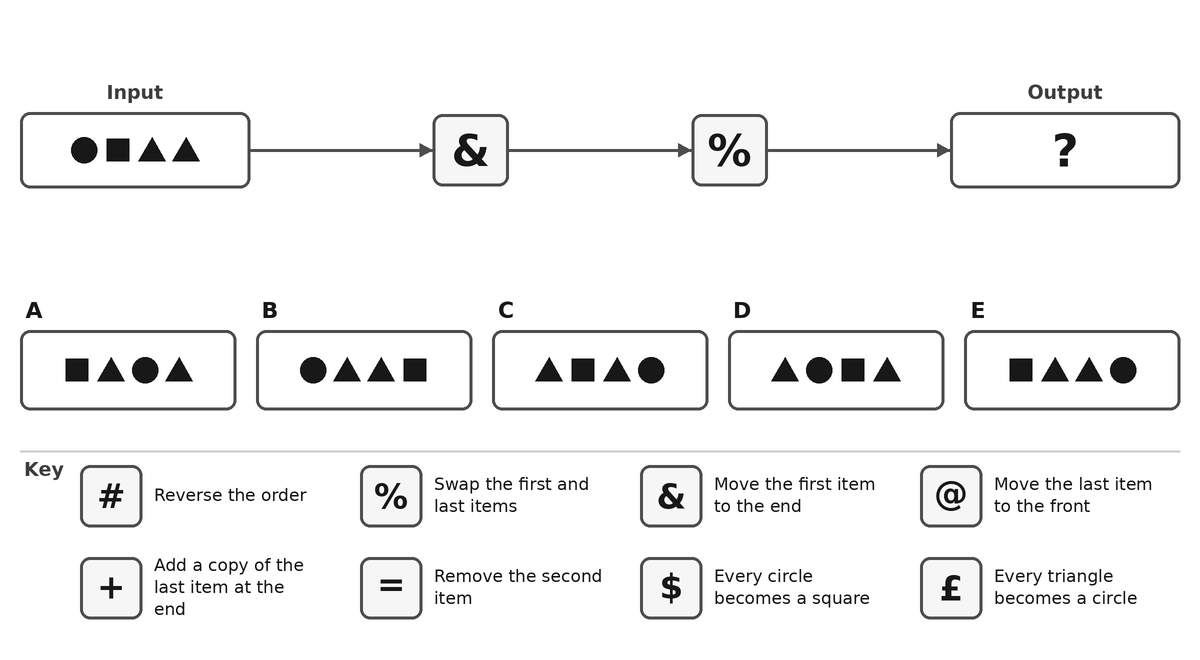 Diagrammatic Reasoning Test24 flowchart questions in 20 minutes. Candidates follow rule-based steps, handle Yes/No switches and work out missing steps.
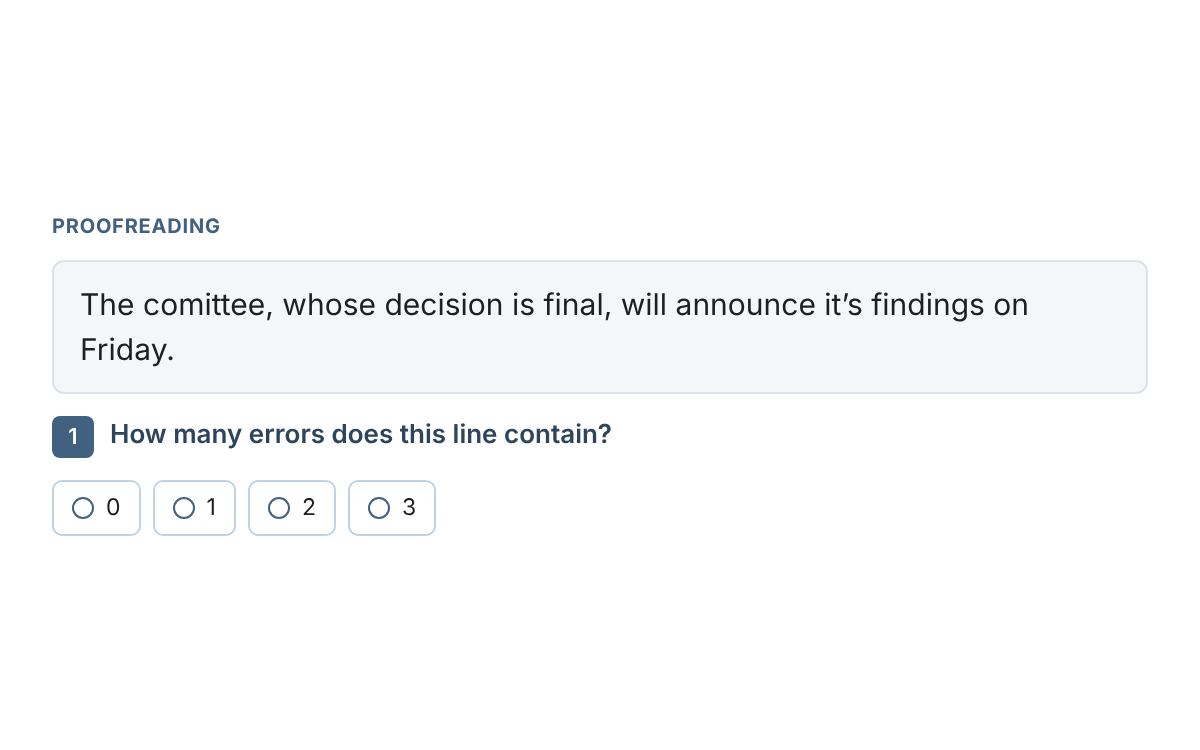 Spelling, Grammar and Proofreading Test30 questions in 15 minutes across three parts: spelling, grammar and usage, and proofreading a workplace text.
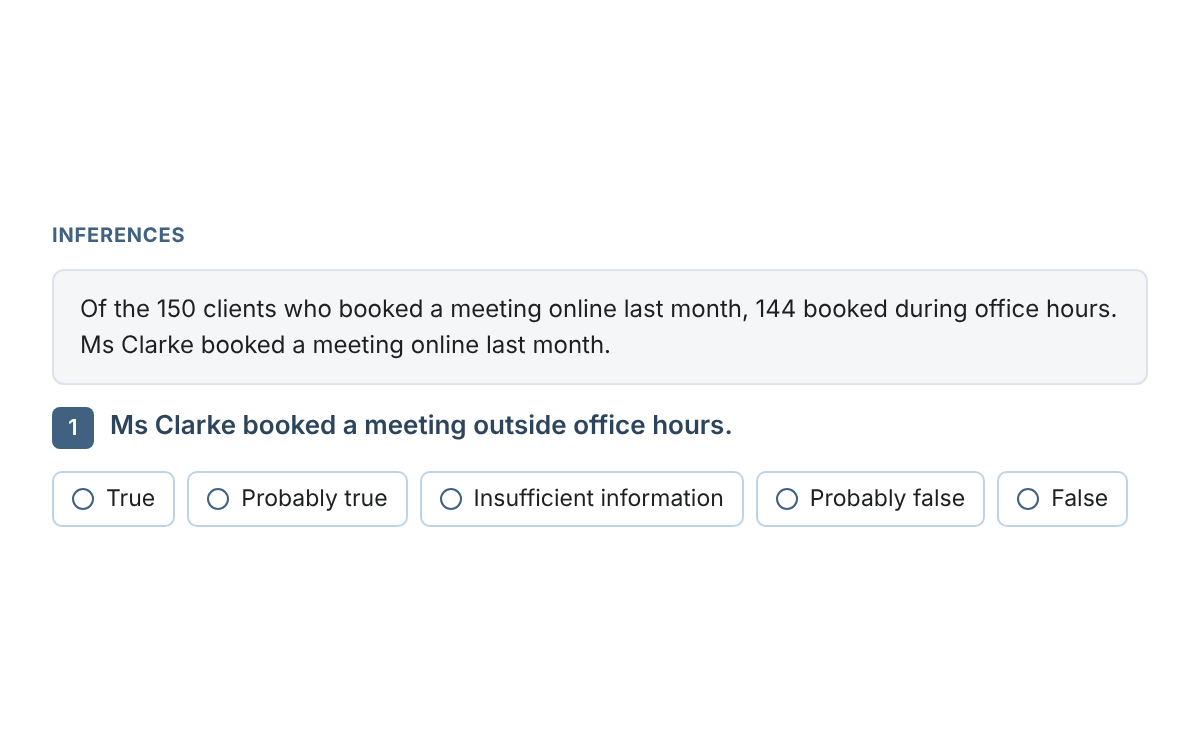 Legal Critical Thinking Test30 legal-practice questions in 30 minutes across five sections: inferences, assumptions, deductions, interpretation and evaluating arguments.
How candidates can do their best
Read the labels first
Check the title, units, time periods and where each axis starts before looking at the numbers.
Watch the axis
A bar chart whose axis doesn't start at zero can make small differences look big.
Know the difference
Percentage points are not the same as per cent, and totals are not the same as per-head figures.
Use "Cannot tell" properly
Choose it when the data really doesn't settle the statement, not because a question is hard.
See the Data Interpretation Test for yourself
Try it and see the reports your team would receive. Contact us for a free trial or a demonstration of the platform.
More Free Tests
Try additional psychometric tests for free:
Take a Free SJT Take a Free Personality Test Take a Free Critical Reasoning Test Take a Free Barista SJT